

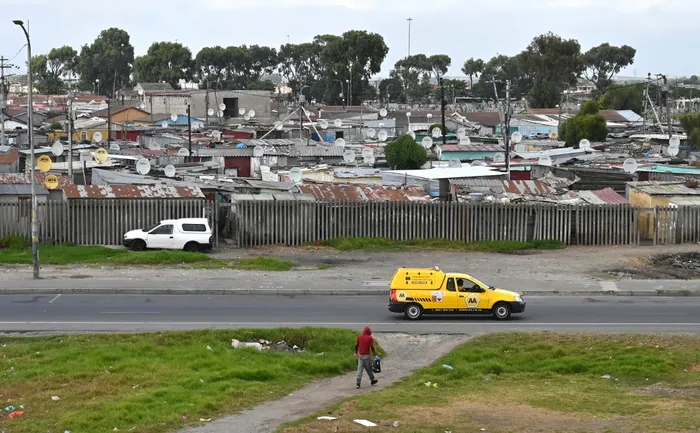
A new analysis argues that the decline of formal employment is closely linked to weakening democratic participation, revealing a growing divide between prosperous and struggling communities.
Image: Ayanda Ndamane / Independent Newspapers
Post apartheid South Africa has never experienced the level of tumult it has witnessed over the last fifteen years.
The hosting of the National Democratic Revolution summit is one in a series of reflective moments examining what has happened to the country.
Unsurprisingly, everyone should be concerned.
Through the Lehohla Ledger, I draw a comparison of democratic performance across Sandton, a mere 75 metres from Alexandra. The environments are like chalk and cheese, or, to put it mildly, heaven and hell.
Sandton enjoys the highest employment rates and the greatest democratic dividend. This stands in stark contrast to the other selected areas. However, democracy in Sandton comes at the high cost of fear.
High walls surround triple storey homes, making the houses disappear behind security fences.
This is a false democracy, albeit one with full stomachs, occasional water outages and increasingly frequent potholes.
Labour Dissolution (LDI) vs Democracy Collapse (DCI): Inter Regional Correlation (2022 Baseline). The Lehohla Ledger contends that South Africa's democratic challenges are rooted in deepening economic exclusion, with stark contrasts emerging between regions such as Sandton and Alexandra.
Image: Supplied.
The scatter diagram, titled "Labour Dissolution (LDI) vs Democracy Collapse (DCI): Inter Regional Correlation (2022 Baseline)," offers a rigorous empirical assessment of the structural relationship between economic exclusion and electoral participation in South Africa.
By plotting the Labour Disappearance Index (LDI), a measure of formal sector attrition, against the Democracy Collapse Index (DCI), which quantifies the electoral participation gap, the graph provides a quantitative synthesis of the "Dual Devastation" that has reshaped the nation's political economy over the last 32 years.
The narrative presented by this diagram is one of extreme polarisation, anchored by a strong positive spatial autocorrelation.
With a global Moran's I score of 0.78 (p < 0.001), the data demonstrates that democratic legitimacy does not collapse in isolation.
Rather, it follows a spatial logic in which the dissolution of formal labour directly precipitates the hollowing out of democratic institutions.
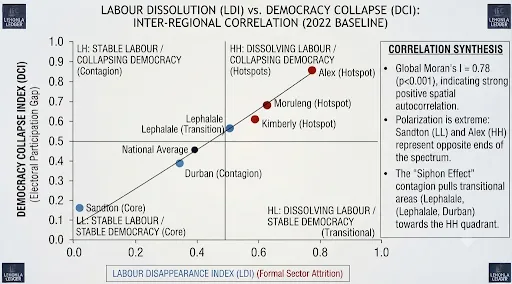
The diagram is organised into four logical quadrants that categorise the socioeconomic and democratic status of various regions.
Image: Supplied.
LL: Stable Labour and Stable Democracy (The Core): Located in the lower left quadrant, Sandton serves as the anchor of stability. With a low LDI of less than 0.2 and a correspondingly low DCI of less than 0.2, it represents the "Core Stability" zone where the formal economy continues to effectively link citizens to the democratic process.
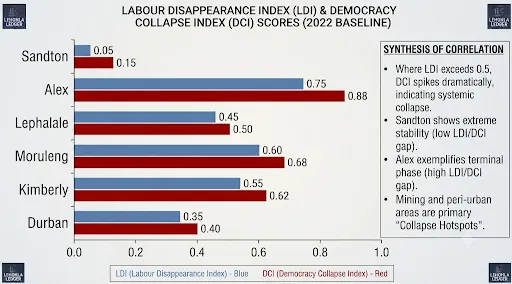
HH: Dissolving Labour and Collapsing Democracy (The Hotspots): The upper right quadrant houses the "Collapse Hotspots," where both indices have surged beyond the 0.5 threshold. Alexandra sits at the extreme end of this spectrum, with an LDI of 0.75 and a DCI of 0.88, epitomising the terminal phase of the "Disappearing Labour Theory." Moruleng and Kimberley are similarly positioned, confirming that these areas have reached a point of systemic stagnation.
LH and HL (The Transitional Zones): Regions such as Lephalale and Durban occupy the transition space between the core and the hotspots. Their trajectory, as indicated by the trend line, shows they are being pulled towards the HH quadrant by the "Siphon Effect," the systematic extraction of value from the periphery to the centre.
The scatter diagram functions as a forensic map of the "Siphon Effect."
It illustrates that as the formal labour pool, measured by the LDI, disappears, the social contract effectively dissolves. In the High High quadrant, the political class can no longer rely on traditional mobilisation strategies. Having discarded the proletariat through automation and global industrial restructuring, the system has destroyed the very mechanism for political alignment.
The visual evidence provided by the trend line suggests that once a region's LDI crosses the 0.5 threshold, the DCI rises disproportionately.
This indicates a tipping point where the perception of electoral futility becomes entrenched.
For the 12 million citizens residing in the 4 000 collapsed voting districts, the democratic process is no longer perceived as a vehicle for advancement, but rather as a system of exclusion.
For the Electoral Commission of South Africa (IEC), this diagram is not merely a statistical summary. It is a diagnostic tool requiring urgent intervention.
It argues that universal, standardised voter education is obsolete in the face of such granular, spatially concentrated collapse.
The synthesis on the right side of the diagram underscores three core imperatives.
Localised Intervention: Because the collapse is spatially clustered, as shown by the HH quadrant, interventions must be decentralised. The proposed Community Catalyst Compact (C3) should be implemented specifically in these hotspots to reconnect the surplus population to the state apparatus.
Addressing the Divergence: The widening gap between the core, represented by Sandton, and the hotspots, represented by Alexandra, confirms that South Africa is becoming a dual society. The state must move beyond the illusion of aggregate success and focus on the spatial realities revealed by the census mesh.
Data as Emancipation: The use of granular data to identify these clusters enables a shift from passive observation to active, catalytic engagement. By targeting the 4 000 collapsed voting districts with specific, self liquidating investments, the IEC can begin to reverse the trajectory of the DCI.
In conclusion, the scatter diagram provides the empirical foundation for the Lehohla Ledger's central thesis that the integrity of the vote is inseparable from the integrity of the mesh.
The collapse of democracy in districts such as Alexandra is not an accident of history. It is the predictable outcome of a 30 year process of systemic economic extraction. To restore legitimacy, the state must acknowledge this geography of despair and prioritise the reconstruction of the institutional linkages that have been severed by the Great Siphon.
Dr Pali Lehohla is the former Statistician General of South Africa, Director of the Pan African Institute for Evidence (PIE), and the founder of the Lehohla Ledger. He is a Professor of Practice at the University of Johannesburg and a Research Associate at Oxford University.

Dr. Pali Lehohla is the former Statistician-General of South Africa, Director of the Pan African Institute for Evidence (PIE), and the founder of the Lehohla Ledger. He is a Professor of Practice at the University of Johannesburg and a Research Associate at Oxford University.
Image: Supplied
Follow Business Report on Facebook, X and on LinkedIn for the latest Business and tech news.